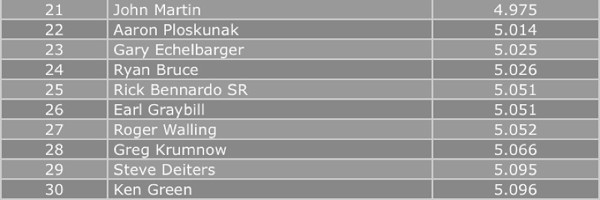
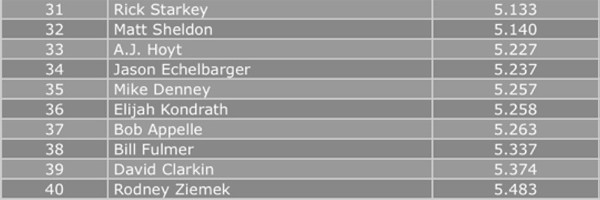
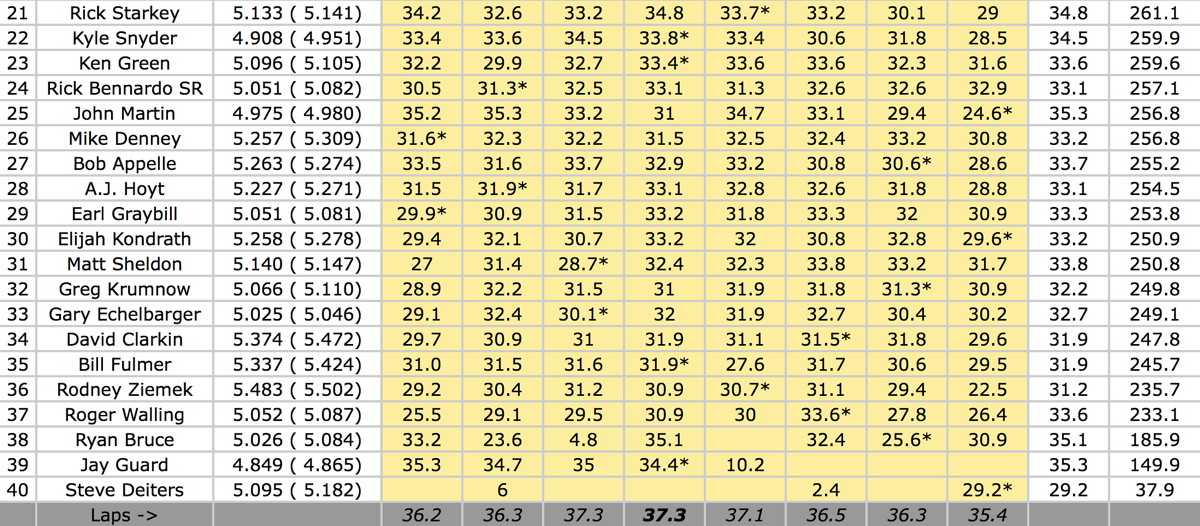
I have a suspicion that a lot of viewers of this R4/8 thread don't know about the detailed data provided by the LapMaster timing system and I wanted to point out a few of its really neat features.
Here's how to access the secondary data panels.
If you click to go to the Tom Thumb "live timing" page, you'll see, in part, this screen:

Click on the "click here for timing and statistics" circled in red to get to the data screens, which look like this for the R4/8.

The top line, labeled "results", gives the overall results for the Can-Am class.
The next four lines give the data for the Can-Am A Main, which was termed the "Final" elsewhere in this thread.
Clicking the first of the four lines - "Laps / Overall best - Retro Can-Am" - brings up the results as shown in post #84 in this thread.
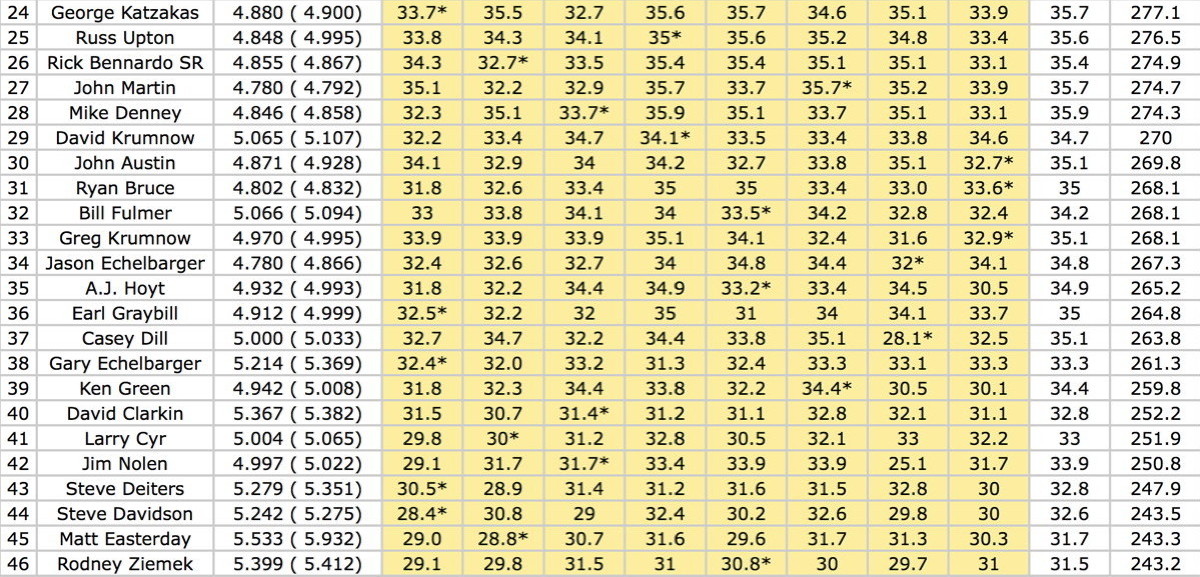
Clicking the second line - "Lap time / Overall best - Retro Can-Am" - bring up this data, each driver's best lap time in each lane. The racers who turned the top three best times on each lane are also indicated.

Clicking the third line - "Actual/Potential / Overall best - Retro Can-Am" - brings up this screen, which is the most interesting one IMO. This screen shows how close each driver came to the "perfect heat", one where every lap equals his fastest lap on that lane (which would be a 100% rating). Again, the racers who turned the top three percentages on each lane are also indicated.

Clicking the fourth line - "Race development / - Retro Can-Am" - brings up this screen which shows each driver's position heat by heat as the race progressed. In this specific instance, one easily can see that Cap Henry led flag to flag in the Can-Am Final.

There's no other time/lap counting program that automatically generates such a volume of interesting data for every race. And no, Carsten didn't pay me to say this (though donations are always welcome, Carsten... LOL!).
As I said, I think many viewing this thread are not aware of the detailed data available to them for each race and wanted to give a little tutorial on how to locate it.


